Every organization that adopts Snowflake eventually runs into the same paradox: the platform’s elasticity is both its greatest strength and its biggest blind spot. Without a purpose-built monitoring tool, Snowflake cost can climb quietly in the background as warehouses spin up, queries run long, and credits burn with no one watching.
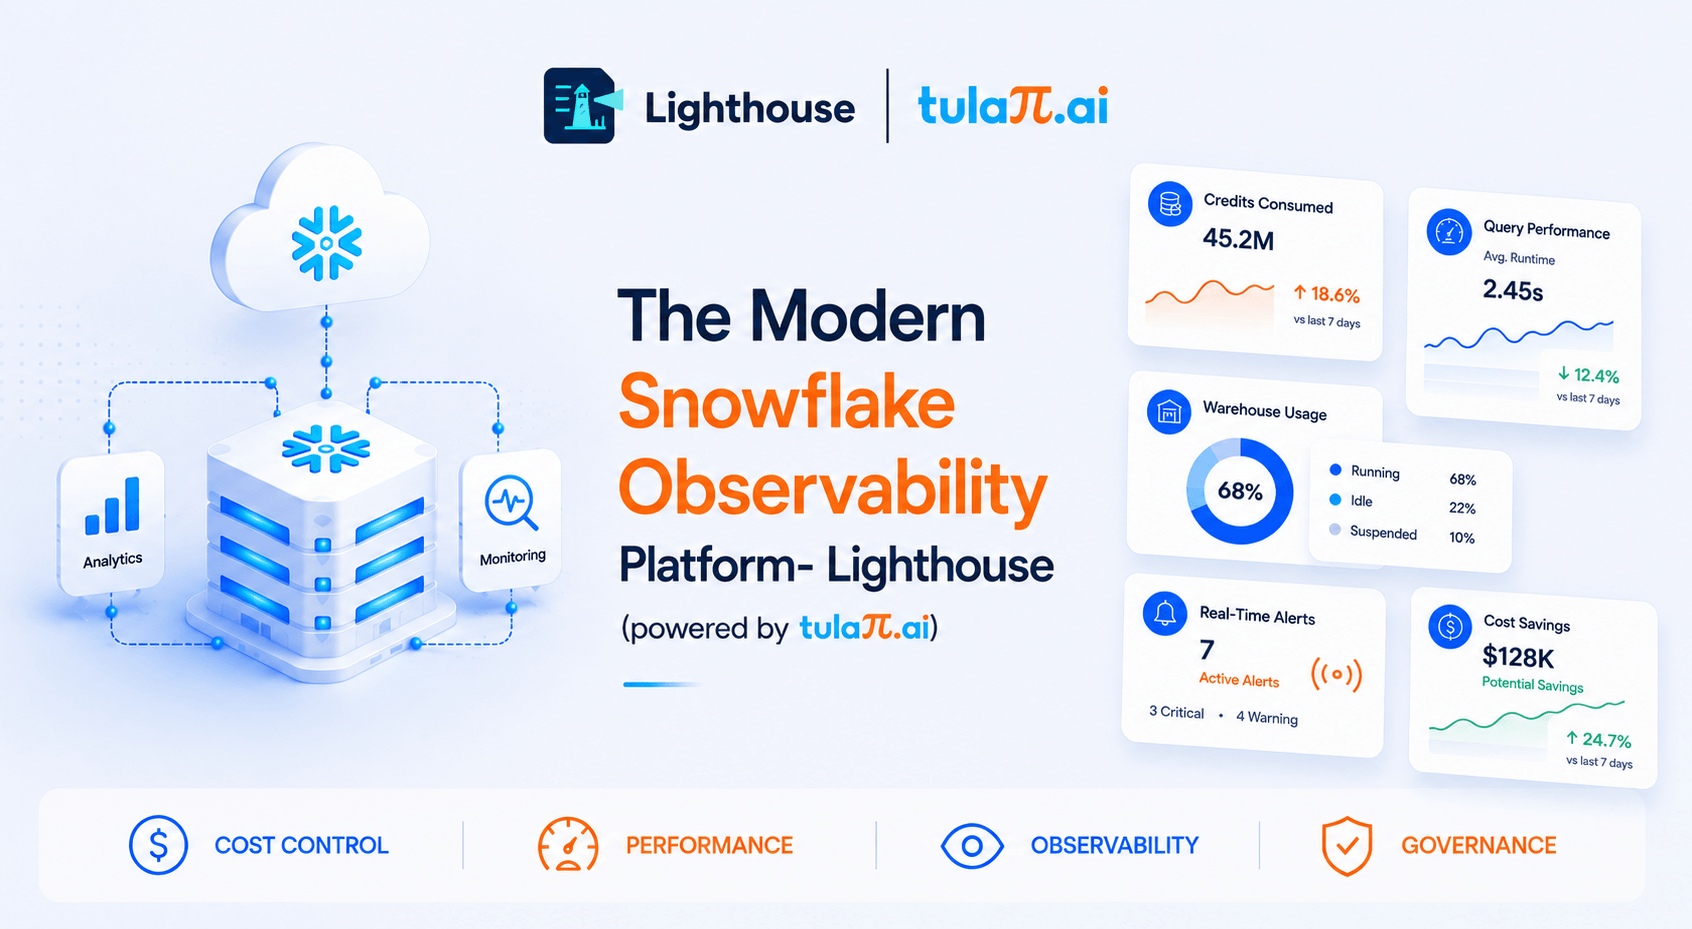
Lighthouse was built to close that gap. It is a credit monitoring and observability platform that gives engineering and finance teams a single, real-time view of exactly how every credit is consumed. Unlike the spreadsheet-driven workflows that often accompany data migration tools, Lighthouse turns raw usage data into decisions, and it starts delivering value immediately with free credit monitoring, so teams can see the picture before they commit.
The Problem: Cost Without Context
Snowflake’s consumption-based Snowflake pricing model means you pay for what you use, but “what you use” is notoriously hard to attribute. A single inefficient query, an oversized warehouse, or a forgotten scheduled job can quietly cost thousands. Native usage views exist, but stitching them into a coherent story takes effort most teams never find the time for. The result is a familiar pattern: a surprise invoice, a scramble to find the culprit, and no systematic way to prevent it from happening again.
Lighthouse replaces that reactive cycle with continuous, contextual visibility, the same way network monitoring tools like the SolarWinds Network Performance Monitor brought visibility to infrastructure teams a generation ago.
A Dashboard That Tells You What’s Wrong, Now
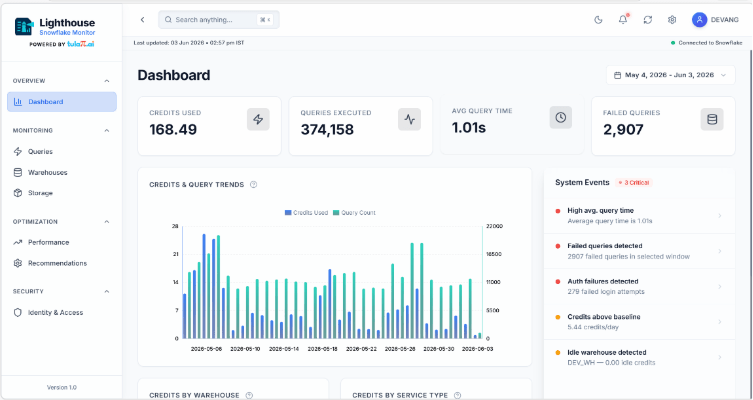
The Lighthouse home dashboard opens with the metrics that matter: credits used, queries executed, average query time, and failed queries, all rolled up across whatever timeline you define. More importantly, it doesn’t just report; it warns. When something drifts out of line, Lighthouse surfaces an immediate alert so you can act before the next billing cycle, not after.
Queries: Finding the Expensive Truth
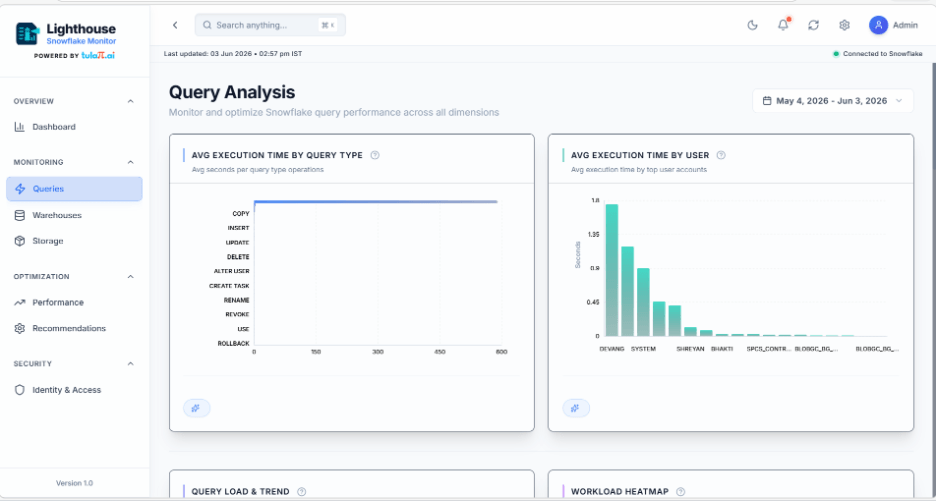
Most of a Snowflake bill traces back to a small number of badly behaved queries. The Queries tab gives you a forensic view of that long tail. It breaks down average execution time by query type and by user, and renders a query-load workload heatmap so you can see exactly when your data warehouses are under pressure. From there it isolates the real offenders: the most expensive queries, the long-running ones, queries spilling data to disk, those suffering from poor partition pruning, and the high-frequency “robotic” queries that quietly hammer your Snowflake database around the clock. This is the layer where optimization actually pays off.
Get instant visibility into the queries consuming the most credits. Register for Knowledge session
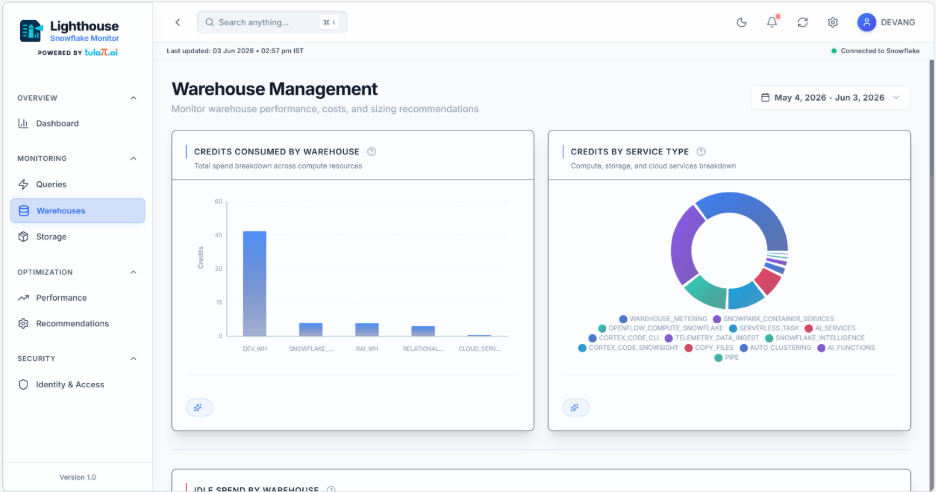
Warehouse Management: Right-Sizing Spend
Compute is where credits disappear fastest, so Lighthouse dedicates a full view to it. You can see USD consumed by warehouse and by service type, pinpoint idle spend where warehouses are running but doing nothing useful, and instantly identify over-provisioned and under-provisioned warehouses. That single insight, knowing which warehouses to shrink and which to scale, often delivers the largest and fastest savings, turning Snowflake software spend from a fixed mystery into a tunable dial.
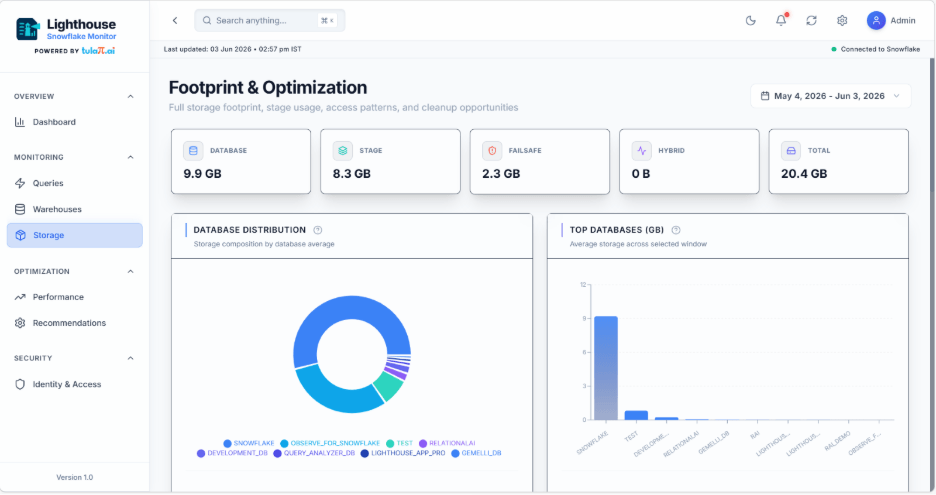
Storage and Recommendations
Compute gets the headlines, but storage adds up too. The Storage view maps database distribution, ranks your top databases, and shows your overall storage footprint, making it easy to spot data that has outlived its usefulness. Tying it all together, the Performance and Recommendations tab consolidates queries, warehouses, and storage into a prioritized action list: what to fix first, what to defer, and the expected impact of each change. It is the difference between data and direction.
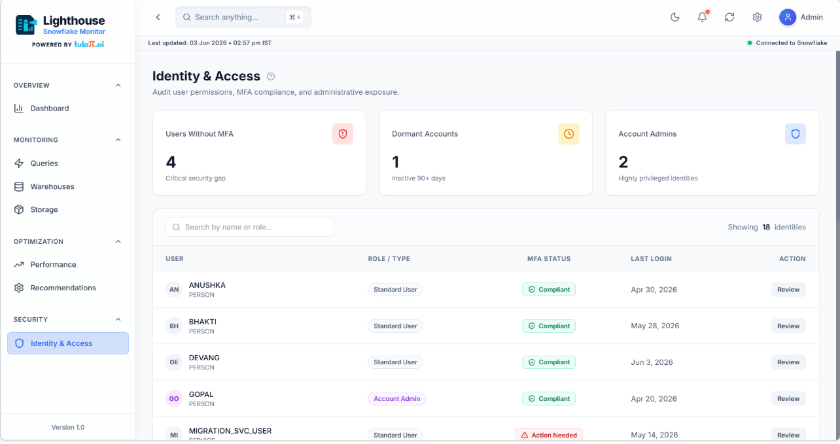
Identity and Access: Governance in One Place
Cost and security are two sides of the same governance coin, and Lighthouse treats them that way. The Identity and Access tab gives administrators a clear roster of every user on the account: who has enabled MFA, who has logged repeated password failures, and who should be deactivated. Crucially, you can activate or deactivate users directly from the same screen, with no jumping between consoles. It is observability that protects the account, not just the budget.
Why It Matters
Adopting Snowflake is rarely the end of a data journey; it is usually the middle, often following a wave of data migration services that move legacy workloads into the cloud. The moment that migration completes, the cost meter starts running, and that is precisely when most teams have the least visibility. Lighthouse exists for that moment. It gives data engineers, platform owners, and finance leaders a shared source of truth, replacing guesswork with measurable accountability.
The broader Snowflake ecosystem keeps growing, with Snowflake training, Snowflake certification, and the annual Snowflake conference all helping teams build expertise. Lighthouse complements that knowledge with something equally important: control. Because in a consumption world, understanding your Snowflake usage isn’t a nice-to-have; it’s the difference between scaling confidently and scaling blindly.